
CYCLES PROJECTIONS REPORTS
NEW CYCLES PROJECTIONS REPORTS FOR INSTITUTIONAL FUND MANAGERS
Cycles Research powerful new software can project any price series forward creating a price projection. Stocks, commodities, and markets can be ranked as to their positions within their own price cycles.
This can be done on a short or a long-term basis. Cycles are scientifically and systematically computed and then tested in dollar terms so that the user will know, on a trailing basis, which cycles are effective in detecting future price movements. Not only are cycle turning points projected in advance, the magnitude of the move can also be measured. This methodology is far advanced over other cycle models or technical analysis in that back test results are immediately and clearly available. CP was developed by a professional fund manager to better judge when to buy and sell.
Your portfolio or basket of tradable stocks can be measured on this basis to keep you ahead of your competitors and the markets.
Cycles drawn out of the data, tested, and a buy-and-sell signal test is run to test profitability over the last year. Below is a CP of XLE, the number 1 ranked ETF in the summary table below.
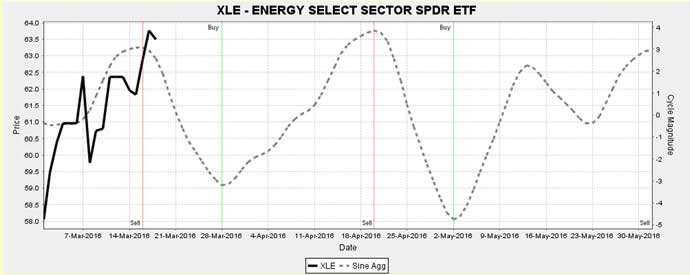
There is no guess work or the use of loose-fitting screen projections. As I theorized before I began this project, spectral analysis does identify statistically valid cycle in the data, but these cycles do not necessarily make money if one trades utilizing them. Having run these tests many times, I have seen about 65% to 75% of the generated cycles vanish when the buy-and-sell test is applied.
If this approach does not produce profitable results with a specific stock, the testing will alert the user. I have found that stocks like MMM on the NYSE do not work as well as other stocks such as BA and MCD. I think that this is due to the fact that MMM makes a varied number of products, no one of which dominates the bottom line. However, there is no question as to what Boeing and McDonalds do. It is easier to get a grasp on value with BA and MCD.
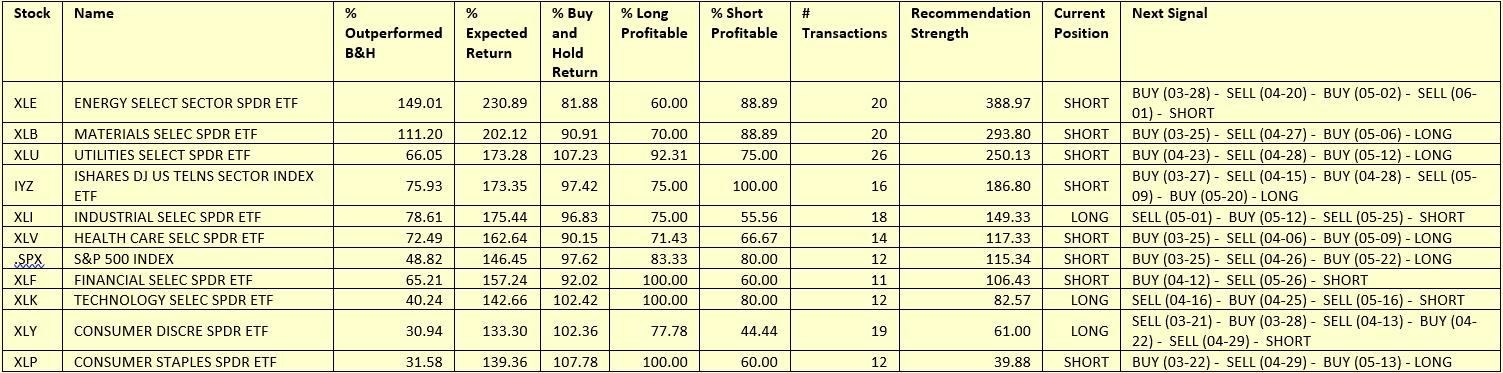
The table below the graph summarizes such tests for the DJIA stocks. The stocks are ranked according to a factor called Recommendation Strength. This is a summary rank that includes the accuracy for the last year combined with the expected magnitude of the move. The analysis is based upon daily cycles.
The two last columns show the current position and the date of the next signal change. Thus, the system was short XLE until March 28, when it recommends a purchase. The most important two columns are the last two, Current Position and Next Signal.
Cycles Projection Summary For Sector ETFs
Contact CR at bill@cyclesresearch.com for details.